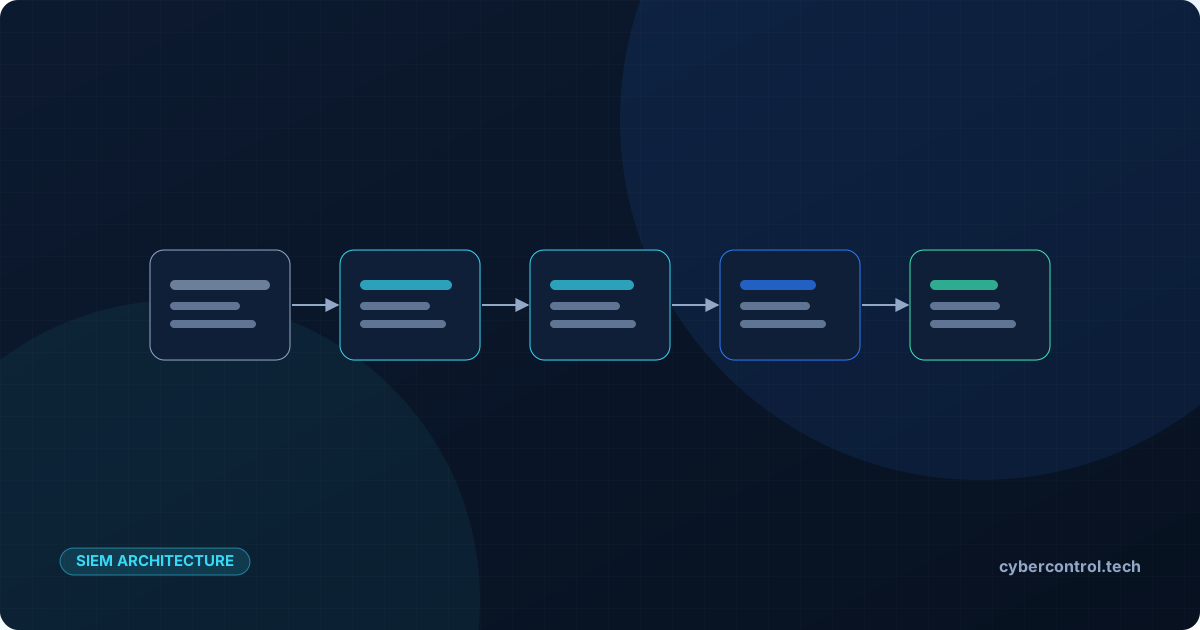
A Security Information and Event Management (SIEM) platform is often described as "the place where logs go". That description hides most of the work. A SIEM is only as good as the chain that feeds it: if any link is weak, attacks pass through without a single alert. This guide walks through each link, the common ways it fails and how to prove that the whole chain works.
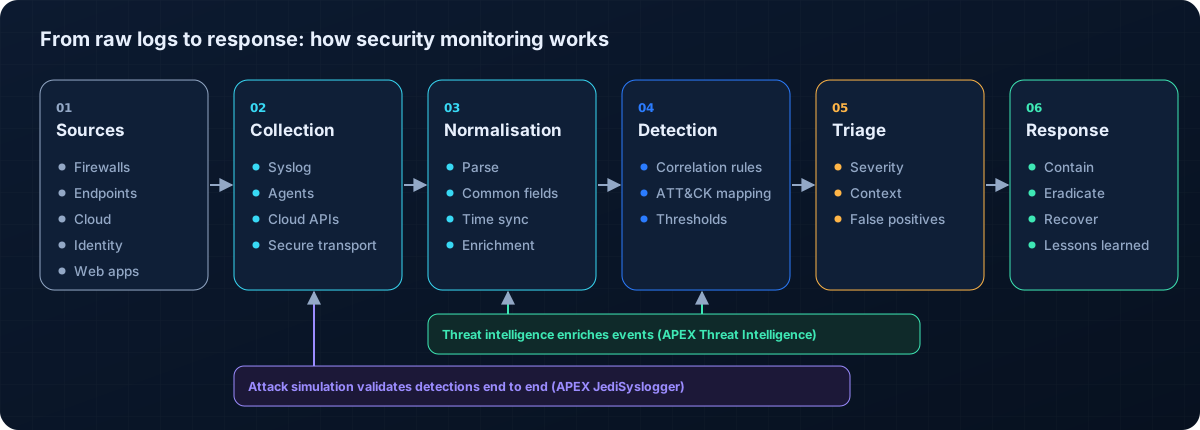
1. Log sources: decide what you need to see
Start from the attacks you care about, not from the devices you own. Ransomware, account takeover and data theft each leave traces in different places:
- Identity: directory services, single sign-on and multi-factor authentication logs show who signed in, from where and how.
- Endpoints: process creation, PowerShell and service installation events show what ran on a machine.
- Network: firewalls, proxies, DNS and VPN logs show where traffic went.
- Cloud and SaaS: audit trails from cloud providers and office suites show configuration changes and mailbox access.
- Applications: web servers and business applications show abuse of the services you expose.
A useful rule: for every high-priority attack technique, name at least one log source that would record it. Where there is none, you have found a visibility gap before an attacker does.
2. Collection and transport
Logs reach the SIEM through agents, syslog, APIs or event collectors. Each has trade-offs. UDP syslog is simple but can lose messages under load; TCP adds reliability; encrypted transports protect data in transit. HTTP collectors such as the Splunk HTTP Event Collector use tokens and batch events efficiently.
What matters most is that you know when a source goes quiet. A firewall that stops sending logs looks exactly like a firewall that sees nothing suspicious. Monitor the volume of every important source and alert when it drops.
3. Parsing and normalisation
Every vendor writes logs differently. One firewall writes src=203.0.113.45, another SourceIP: 203.0.113.45, a third puts the address in the seventh comma-separated field. Parsing extracts the values; normalisation puts them into common field names, so that one rule can work across all of them.
This is where many SIEMs quietly break. A vendor update changes a field order, a parser stops matching, and events arrive with the important values still buried in the raw text. Rules that depend on those fields stop firing, and nothing tells you.
4. Detection rules and correlation
Rules turn normalised events into alerts. Simple rules match a single event, such as the creation of a new administrator account. Correlation rules combine events over time: many failed sign-ins followed by a success from the same address, or a sign-in from two countries an hour apart.
Good rules are:
- Mapped to an attack technique, ideally in MITRE ATT&CK, so coverage can be measured.
- Specific enough to avoid flooding analysts with false positives.
- Documented, with what the alert means and what to do next.
- Tested, with an event that should trigger them and one that should not.
5. Enrichment with threat intelligence
An IP address in a log means little on its own. The same address flagged by several threat feeds as a command-and-control server means a lot. Enrichment adds reputation, geolocation, asset ownership and vulnerability context to events, which helps analysts decide in seconds instead of minutes. Threat intelligence platforms such as APEX Threat Intelligence keep these indicators current and de-duplicated.
6. Triage and response
Alerts need owners. Define severity levels, response times and playbooks for the most common alerts, and make sure every alert ends with a decision: false positive, benign, or incident. Feedback from triage is the best source of rule tuning.
7. Prove that it works
The only reliable way to know a SIEM detects an attack is to show it one. Detection testing replays realistic attack activity, in the formats your real sources produce, and checks which alerts appear.
| Test result | What it means | Typical fix |
|---|---|---|
| Alert raised as expected | The chain works for this technique | Re-test after changes |
| Event arrived, no alert | Rule missing or not matching | Write or tune the rule |
| Event arrived unparsed | Parser gap | Fix the parser or field mapping |
| Event never arrived | Collection or transport gap | Fix the source or collector |
APEX JediSyslogger was built for this loop: it generates logs in 56 appliance formats, injects 90 attack scenarios and shows the detections its own engine expects, so you can compare them with what your SIEM raised.
Key takeaways
- Choose log sources from the attacks you need to detect.
- Monitor source volume so silence is never mistaken for safety.
- Treat parsing and normalisation as the most fragile part of the chain.
- Map rules to ATT&CK and test them with realistic attacks, regularly.