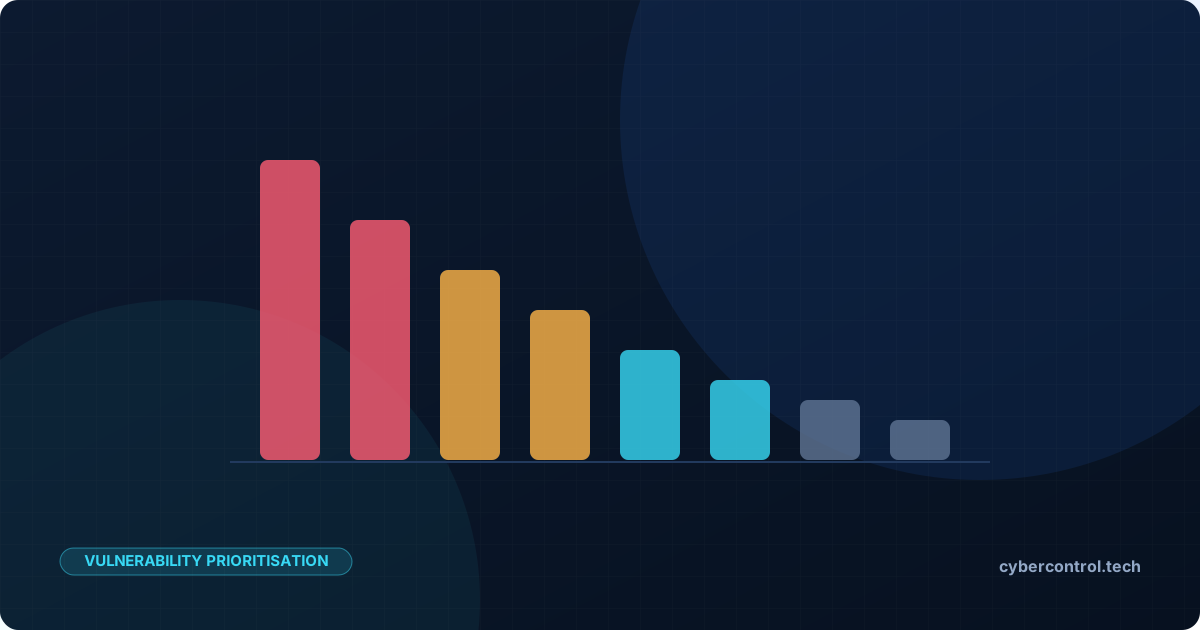
Every year tens of thousands of new vulnerabilities receive a CVE identifier. No organisation can patch all of them quickly, and most do not need to: only a small share is ever exploited in real attacks. The challenge is finding that share. This guide explains the three signals that matter most and how to combine them.
CVSS: how bad could it be?
The Common Vulnerability Scoring System rates the technical severity of a vulnerability from 0 to 10, based on how it can be exploited (network or local access, complexity, privileges needed, user interaction) and its impact on confidentiality, integrity and availability. CVSS v4.0 is the current version; many records still carry v3.1 scores.
CVSS answers how serious would it be if exploited. It does not answer how likely it is to be exploited. A large share of published vulnerabilities score 7.0 or higher, so "patch everything high and critical" quickly becomes an impossible list.
EPSS: how likely is exploitation?
The Exploit Prediction Scoring System, maintained by FIRST, estimates the probability that a vulnerability will be exploited in the wild in the next 30 days. It is a data-driven model updated daily, and its output is a probability between 0 and 1, along with a percentile.
Most vulnerabilities have a very low EPSS score. A small group has a high one, and that is where attention should go.
CISA KEV: is it being exploited now?
The Known Exploited Vulnerabilities catalogue, published by the US Cybersecurity and Infrastructure Security Agency, lists vulnerabilities with reliable evidence of active exploitation and a clear remediation. US federal agencies must remediate KEV entries within set deadlines; for everyone else it is one of the strongest public signals that a vulnerability is a real-world risk.
Europe has its own view through the ENISA European Vulnerability Database (EUVD), which adds European context, vendor and product information and exploitation flags.
Combine the signals
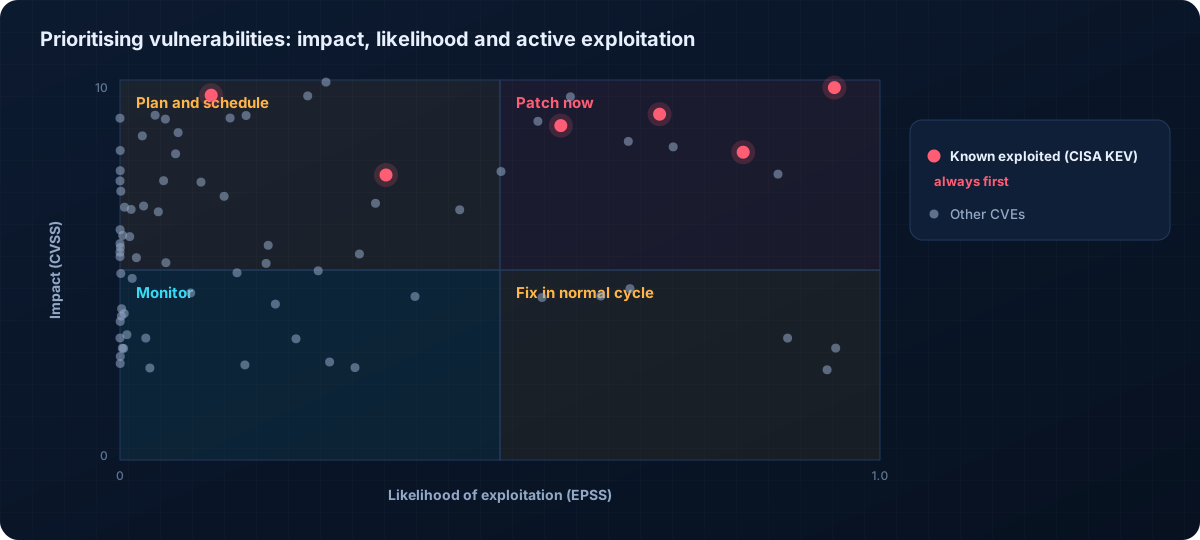
A simple, defensible order of work:
| Priority | Condition | Target |
|---|---|---|
| 1 | In CISA KEV and present on an exposed system | Immediately |
| 2 | High EPSS and high CVSS | Days |
| 3 | High CVSS, low EPSS, internet-facing | Next patch cycle |
| 4 | Everything else | Routine maintenance |
The exact thresholds depend on your capacity, but the principle stays: likelihood and confirmed exploitation decide the order; impact decides the urgency within each group.
Add your own context
Public scores know nothing about your environment. Adjust for:
- Exposure: an internet-facing server matters more than an isolated lab machine.
- Asset value: systems that hold customer data or run production come first.
- Compensating controls: a vulnerable service behind strong access controls may wait.
- Fix availability: when no patch exists, look for vendor workarounds and monitor for exploitation.
Where new CVEs fall through the cracks
Newly published CVEs often have no score for days while analysis is pending. Attackers do not wait for scores. APEX Threat Intelligence handles this by using the score from the CVE Numbering Authority when present, then the NVD score, and an AI estimate, clearly marked as such, when neither exists yet. It also links each CVE to KEV, EPSS and EUVD data and searches for vendor advisories and fixes.
Key takeaways
- CVSS measures impact, EPSS estimates likelihood, KEV confirms exploitation.
- Fix KEV entries on exposed systems first, then high-likelihood, high-impact issues.
- Add your own context: exposure and business value change the order.
- Measure progress as risk removed, not as the number of patches applied.